E-Commerce Satisfaction Benchmark 2026: When Market Leadership Does Not Equate to Quality
The e-commerce market is often assessed by market share, growth figures, and brand awareness. But how satisfied are the people who work with these systems every day? This is precisely the question that the E-Commerce Satisfaction Benchmark 2026 addresses. The analysis compares eleven leading shopping systems based on publicly available Trustpilot reviews (reference date: 01/25/2026).
User Satisfaction as a Hard Currency
The study follows a clear approach: market shares and marketing promises are intentionally ignored. Instead, the focus is on analyzing how shop operators and technologists evaluate the systems in real-world use. User satisfaction thus becomes the central comparison measure – as an indicator of system stability, everyday usability, and long-term viability.
Market Overview: A Significant Discrepancy
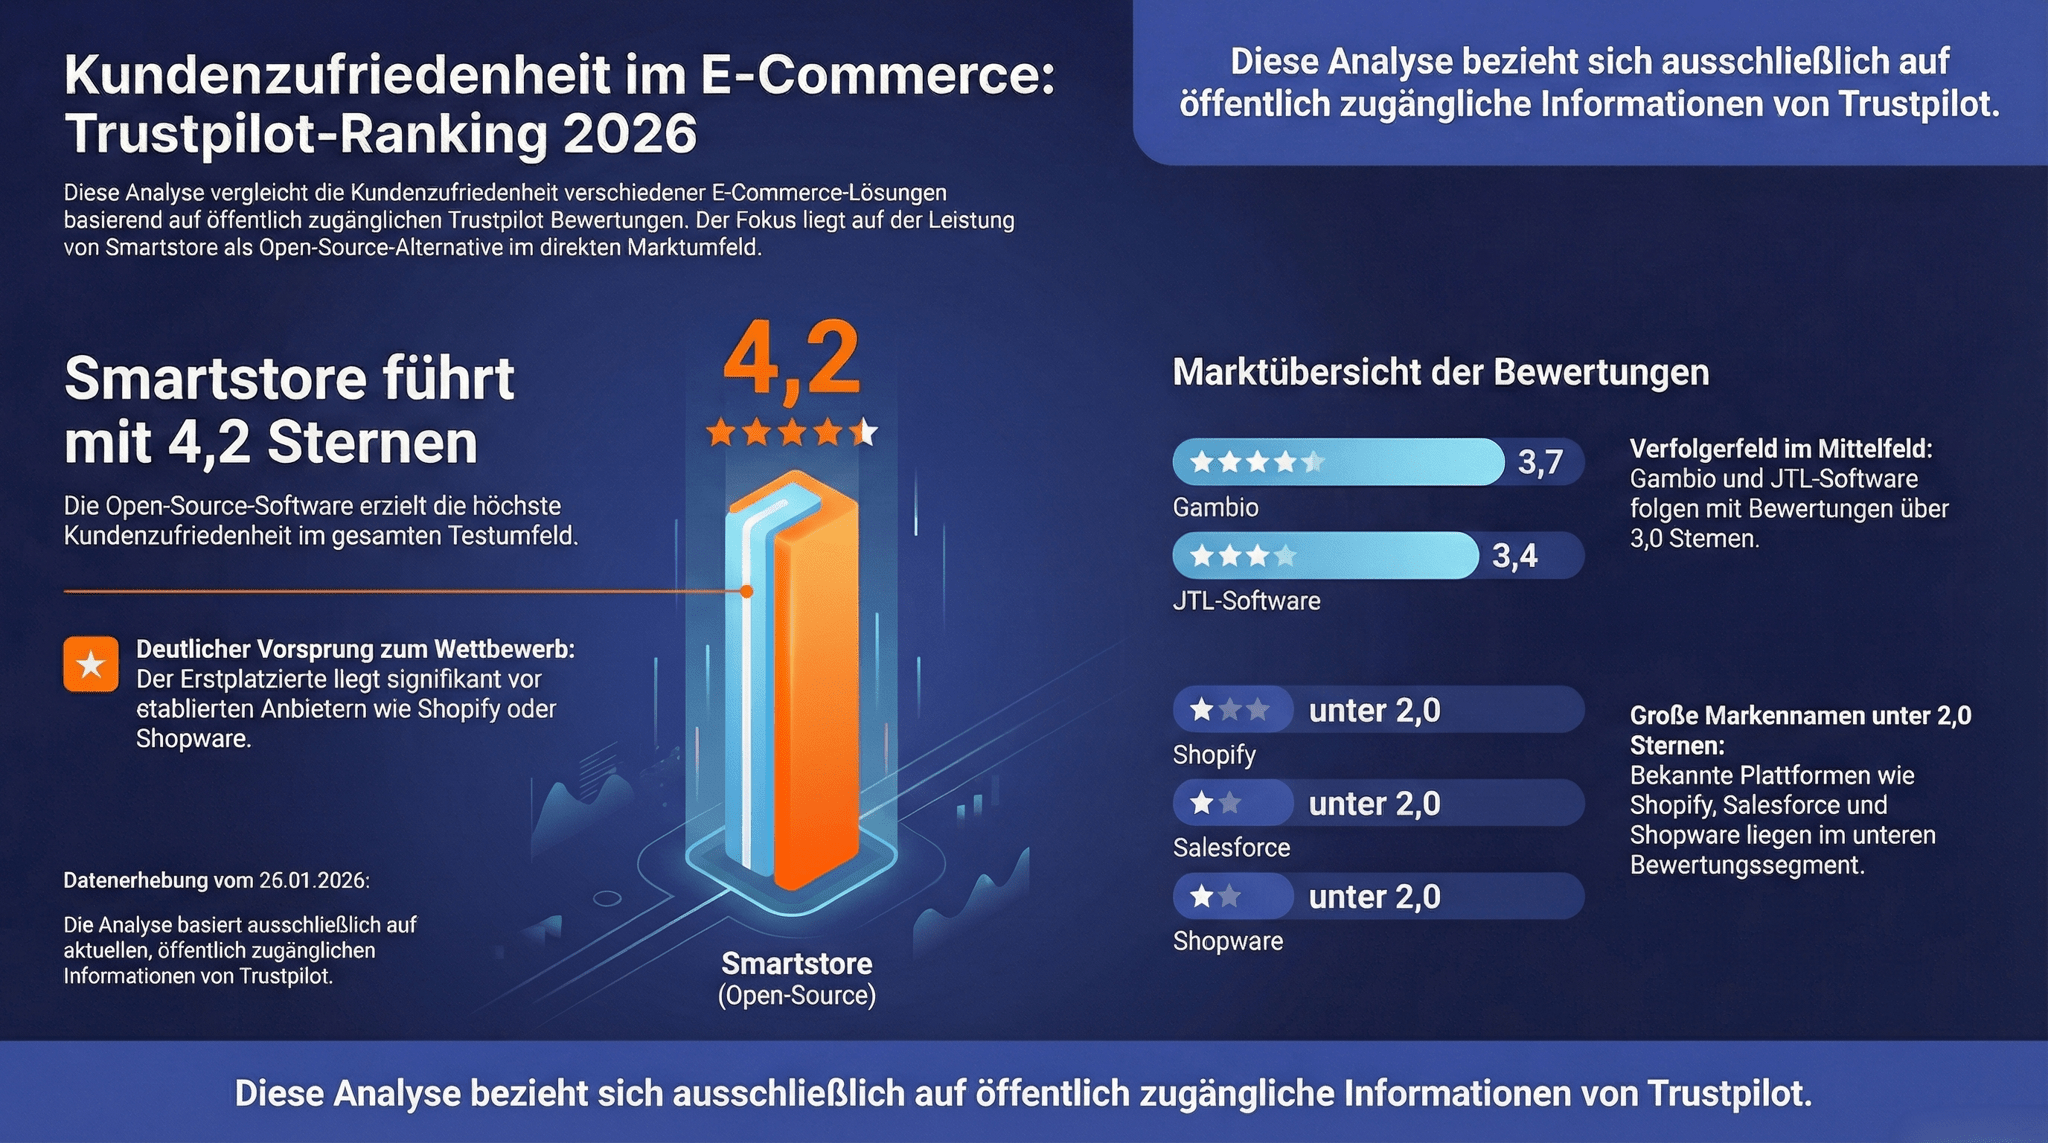
The market overview already shows a significant spread of ratings. Notably, internationally known SaaS and Enterprise platforms are far behind in terms of user satisfaction. Shopify and BigCommerce each achieve only 1.3 stars, while Salesforce is at 1.5 stars. Despite their high prevalence, this segment averages below the 1.5-star mark. The German provider Shopware also achieves only 1.5 stars.
These results highlight a central paradox: High recognition does not protect against sustained criticism. On the contrary – the larger the platform, the more pronounced structural deficits seem to be perceived in daily operations.
The Undecided Middle
In the middle range are established systems like Magento (2.3 stars), WooCommerce (1.9 stars), PrestaShop (1.8 stars) and Plentymarkets (2.5 stars). Although these solutions perform better than the large international SaaS providers, they do not achieve top marks.
The rating situation points to mixed performance: functionally adequate, but without clear differentiation or consistent excitement among users. This segment visibly stagnates between aspiration and reality.
The Leaders: Quality Is Rewarded
Only three of the eleven analyzed platforms exceed the critical 3-star mark: JTL (3.4 stars), Gambio (3.7 stars) and Smartstore (4.2 stars). In this segment, there is a clear correlation between perceived system performance and user satisfaction.
Smartstore as a Benchmark
With 4.2 stars, Smartstore clearly takes the lead in the rankings. The gap to the average of the major international providers is nearly three full rating points. This difference is not cosmetic in nature, but rather an expression of a structural quality advantage.
Notably, the open-source approach stands out. Flexibility, transparency, and adaptability are evidently more appreciated by the community than closed, highly regulated SaaS models. Smartstore thus serves as a benchmark for user-oriented system architecture.
Quality Versus Hype
The direct comparison reveals a significant gap between public perception and actual user experience. While marketing and market shares often dominate the discourse, the satisfaction benchmark presents a clearly different picture: Technological openness and everyday usability outweigh hype and brand strength.
Conclusion of the Analysis
The E-Commerce Satisfaction Benchmark 2026 reaches clear results:
-
Market share does not equate to user satisfaction
-
Open-source solutions perform significantly better
-
The choice of the shop system is more a risk assessment than a guarantee for many companies
The analysis explicitly does not claim to be a marketing statement, but rather a reflection of real experiences from the market. It is based exclusively on publicly accessible Trustpilot data. NopCommerce was not considered due to its geopolitical origin (Russia).
Please click on the image to open the presentation.